

Unified Marketing Dashboards

Stop waiting for the month end deck. See what is working while you can still act on it.

Monthly slide decks tell you what happened after you can do anything about it. We build live dashboards of conversion and channel impact that your team owns and operates.

Unified Marketing Dashboards — hero

Results our clients report to their boards

35:1

Your media return, if your campaign runs like HMS Networks' first one did

£760 to £72

What HMS now pays for a confirmed sales ready lead, down from a typical trade event lead

1,588

Sales ready leads HMS generated on reporting they own and operate

42x

Media efficiency Arrow ECS achieved against benchmark with VMware

Dashboards you own and operate

We build the views into infrastructure you already pay for, using tooling you control. You own the dashboards, the underlying queries and the data. There is no per-seat reporting licence and no platform fee that grows as you add users. When the project ends, the dashboards keep running and your team keeps full control.

Built on a unified model

Good dashboards need good data underneath. We build on the same single model produced by marketing data integration, so every chart reads from one source. This is what stops the familiar problem of two dashboards quietly disagreeing.

What changes for you

What we provide:

  • Live daily and weekly views of conversion, pipeline and channel impact
  • One agreed definition for every metric, so numbers stop being argued over
  • Dashboards built on infrastructure you own, not a rented reporting platform
  • Alerting on the numbers that matter, so problems surface early
  • Documentation and training so your team runs and extends the views

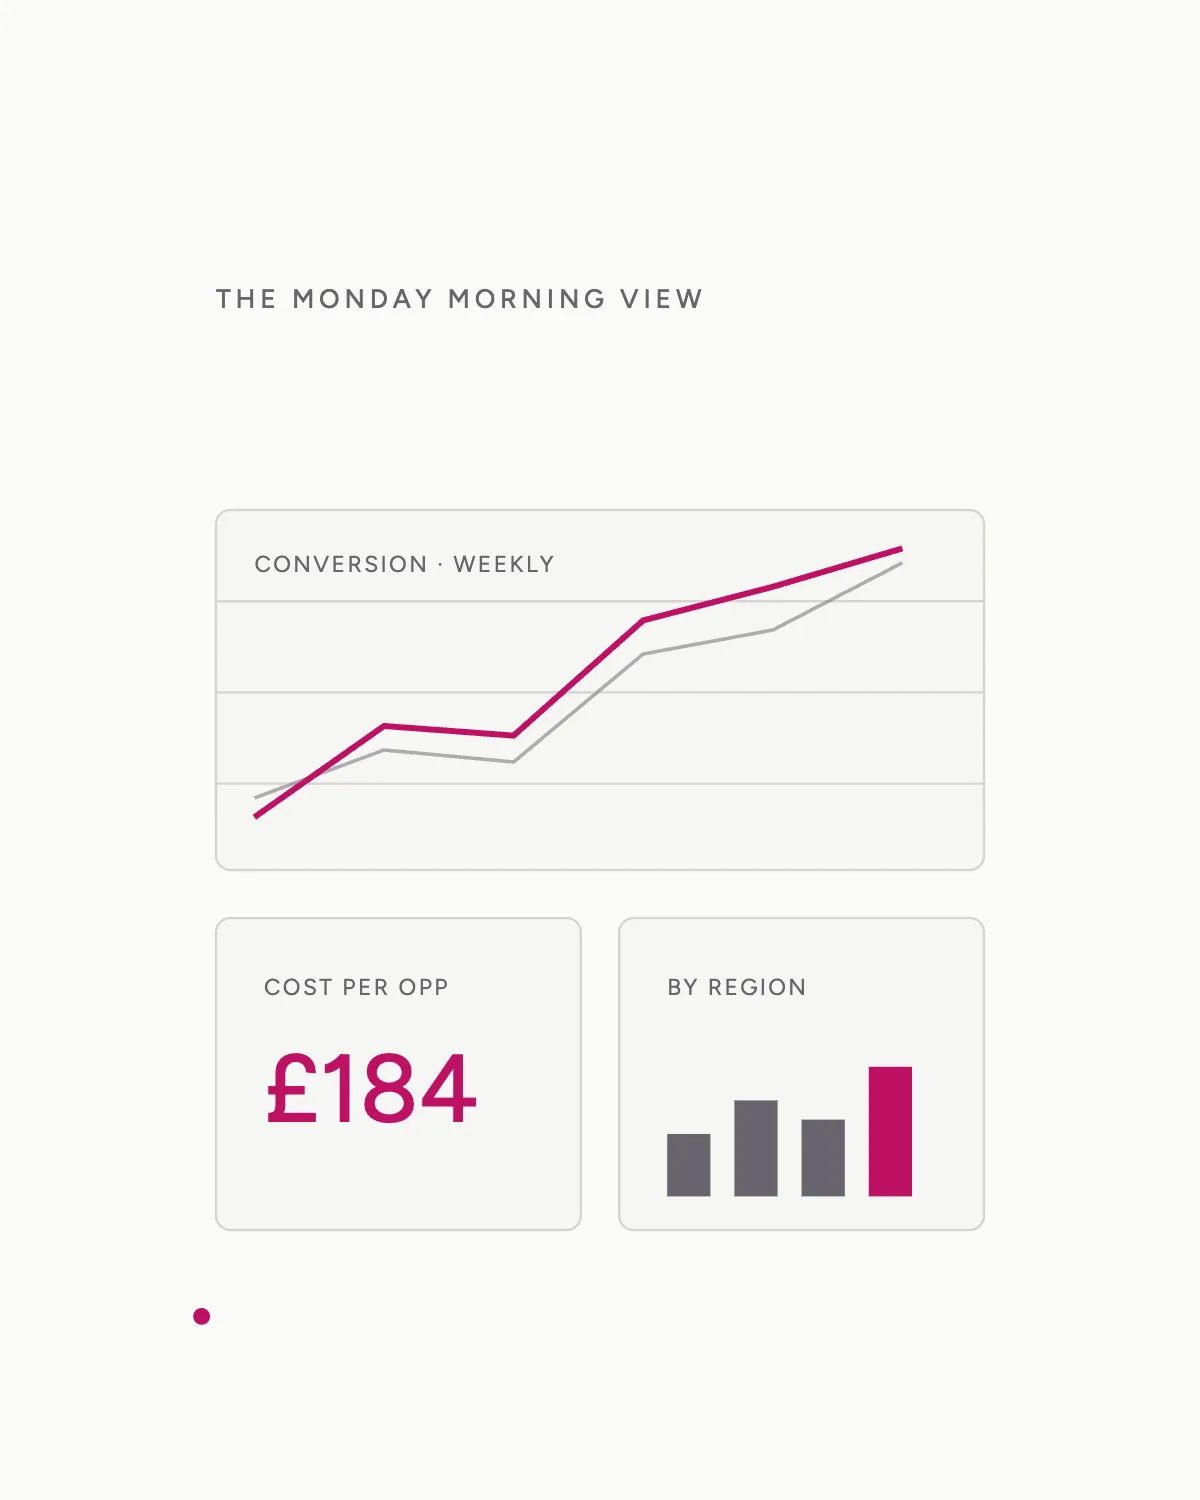
A dashboard is only useful if people trust it and look at it. Too many B2B teams have a wall of vanity charts nobody opens, or a monthly slide deck that is out of date before the meeting starts. We build live dashboards that show conversion and channel impact at a daily and weekly cadence, focused on the handful of numbers that actually move the business.

This is the reporting discipline that helped HMS Networks stay on top of a 35:1 media return and a cost per sales ready lead cut from around £760 to £72. The dashboards run on infrastructure you own, so the views, the data and the logic stay with you rather than living inside a platform you rent.

If your leadership meeting still runs on a slide deck someone rebuilds by hand each month, a live dashboard you own will save those hours and end the data disputes.

See a live dashboard demo

Not suitable for all businesses

This fits if you are

Dashboards earn their keep when decisions are frequent and the data is real. These are the teams that get the most from a live, owned view.

Marketing directors who want one weekly view they can act on and present without rebuilding it by hand.

Operations and campaign teams who need a daily view that flags overnight changes early.

RevOps leads who want conversion and pipeline numbers that match the CRM.

Channel and distribution businesses who need partner performance visible alongside direct activity.

Not the right engagement if

  • You are happy waiting for a monthly export rather than live reporting.
  • There is no unified data underneath for a dashboard to read from yet.
  • You want a rented reporting tool rather than views you own.

How we deliver this

1

Step 1

Weeks 1 to 2

Metric workshop. We agree which numbers matter, define each one precisely, and decide the cadence and audiences for every view.

Outcome

An agreed metric set and dashboard design signed off before any build starts.

2

Step 2

Weeks 2 to 4

Build. We construct the dashboards on your infrastructure, wire in the data and set up alerting on the metrics that matter.

Outcome

Live daily and weekly views, owned by you, reading from one model.

3

Step 3

Weeks 4 to 5

Validation. We check every number against known figures and tune the views with the people who will use them daily.

Outcome

Dashboards your team trusts and actually opens.

4

Step 4

Weeks 5 to 6

Handover. We document the queries and train your team to maintain and extend the dashboards.

Outcome

Full ownership in your hands, with optional support if you want it.

Proof over promises

The question is who builds it, and who owns it afterwards

Why Teylu, not a generic agency

A generic agency hands you a reporting tool login and calls it a dashboard. We build the views into your own infrastructure, tuned to your metrics and your cadence, so what you get is yours to keep rather than a subscription you inherit.

Against an enterprise agency

Quarters, not weeks

Six month discovery phases and a quarter million before a single dashboard exists. We work in weeks, with senior people on every call and pricing itemised line by line.

Compliant by design

Because the dashboards live on your infrastructure, with UK and EU data residency where you need it, you control access and retention. Reporting does not mean shipping your data into someone else's platform.

Start small, own everything

We run dashboard work in three stages. Diagnostic: we agree the metrics, definitions and audiences. Build: we construct and validate the dashboards in infrastructure you own. Embedded: we hand over, train your team and offer ongoing support only if you want it.

Pricing is itemised line by line so your finance team sees what each view and integration costs. There is no opaque contingency block and no per-seat reporting licence buried in the figure. You build an asset you keep. Enterprise grade thinking without the enterprise overhead.

Client testimonials

Star iconStar iconStar iconStar iconStar icon

"Complete dedication to our brand mission by Teylu. They worked within our limitations and made our marketing profitable on first purchase."

Ken Price

Ken Price

CEO, Blake Mill Menswear

Star iconStar iconStar iconStar iconStar icon

"Teylu delivered rapid activation, delivered immediate sales uplift. Assisted in delivering a business exit and increased valuation."

Katie Dixon

Katie Dixon

Founder, Evellier Luxury Intimates

Star iconStar iconStar iconStar iconStar icon

"It's a pleasure to work with the whole Teylu team. They delivered our exact brief quickly to great effect. What more can you ask for?"

Sophie Fresson

Sophie Fresson

Head of Digital, Oceana UK

Unified marketing dashboard questions, answered

Do we own the dashboards or rent them from a platform?

You own them. The dashboards, the queries behind them and the data all sit on infrastructure you already operate. There is no per-seat reporting licence and no platform fee that grows as you add users. When the engagement ends, the dashboards keep running and the asset stays yours. You are investing in infrastructure you keep, not renting views you would lose at renewal.

Which dashboard tool do you use?

We build with tooling you control rather than locking you into a single vendor. The aim is dashboards that live on your infrastructure, so you are not paying a climbing per-seat fee as more of your team starts relying on them. We will recommend the right approach for your stack during the diagnostic.

How quickly can dashboards go live?

If the underlying data model already exists, dashboards are usually live within four to six weeks. If we are building the integration at the same time, we sequence the work so a first operational view appears early and the leadership views follow soon after.

Will the numbers match our CRM?

Yes, because we agree one definition for each metric up front and build on a single unified model. Conversion and pipeline figures read from the same source your CRM uses, which is what stops the familiar problem of two reports quietly disagreeing.

Can we see channel partner performance too?

Yes. We surface distributor and channel contribution alongside your direct activity on the same view, so the full picture sits on one screen. This matters for channel and distribution businesses, like the work we do with Arrow ECS, where partner influence is otherwise invisible.

Book a discovery call

Still weighing it up? Talk to the team that would build your dashboards.

Brief Us
Brief Us

Book your Data and Demand Diagnostic

Tell us where the data lives and what the board keeps asking. A senior person reads every one of these.

Thank you! Your submission has been received!
Oops! Something went wrong while submitting the form.

What happens next

1. A senior person replies within one working day. Not a sales development rep, not an automated sequence.

2. Thirty minutes to scope whether this is the right move. If it is not, we say so and point you somewhere better.

3. You get a written scope, priced line by line. No pitch decks unless you ask for them.